An Analysis of the Prolonged COVID-19 Symptoms Survey by Patient-Led Research Team
Cite as:
Assaf G, Davis H, McCorkell L et al. What Does COVID-19 Recovery Actually Look Like? An Analysis of the Prolonged COVID-19 Symptoms Survey by Patient-Led Research Team. Patient-Led Research Collaborative. Published May 11, 2020. https://patientresearchcovid19.com/research/report-1/
Originally Released: May 11th, 2020. Generated from survey data organized by decentralized team of COVID-19 patients, exported on May 2, 2020 (640 Responses).
Summary
Forward
The goal of this research is to capture and share a bigger picture of the experiences of patients suffering from COVID-19 with prolonged symptoms using a data driven approach. The survey content and research analysis are “patient-centric,” conducted through participatory type research. Survey questions and symptoms were aggregated and curated by patients themselves with expertise in research and survey design. Analysis was also conducted by patients themselves with expertise in both quantitative and qualitative data analysis. This approach is especially important for COVID-19 because patients experiencing symptoms are in need of timely research and content relevant to them that is not currently available due to the novelty of this virus.
It is important to note that this survey targeted patients with prolonged symptoms (patients with symptoms for over two weeks), though it does include a few responses from patients with shorter symptom duration. The survey was primarily distributed to the Body Politic COVID-19 Support Group on Slack, but also was distributed to various other support groups on Facebook and through other personal social media accounts. The survey received 640 responses and was open from April 21st to May 2nd, 2020.
About a quarter of respondents (23.1%) tested positive for COVID-19, 27.5% tested negative, and the remainder (47.8%) were not tested. In our analysis, we included all responses regardless of testing status. Due to the severe lack of testing available in many areas and the prevalence of false negatives, we do not believe people’s experiences with COVID-19 symptoms should be discounted because they did not receive a positive test result. When disaggregating the data, we found that the main difference between people who tested positive and people who tested negative was not necessarily the symptoms they experienced (as most symptoms were similar), but how early in their illness they were able to be tested. We believe that current testing practices are not capturing a large subset of COVID-19 patients and that more investigation into this is required. If we limited the analysis to only respondents who received a positive test result, we could lose valuable information, and would be doing a disservice to the thousands, if not hundreds of thousands, of people with prolonged symptoms who were unable to access a test early enough in their illness, if at all. We believe future research must consider the experiences of all people with COVID-19 symptoms, regardless of testing status, in order to better understand the virus and underscore the importance of early and widespread testing.
When considering the results of this survey, it is important to keep in mind that this sample is not representative of all COVID-19 patients. Sampling bias is at work here: both in who would be willing and able to take a survey, and who would have exposure to the survey. We consider this sample to be disproportionately, white, cis-gender female and U.S.-based; we plan to intentionally conduct broader outreach to create a subsequent version of the survey and report with a more diverse group of respondents. Further, unless indicated, we have not completed significance testing on our findings. Therefore, our results should not be taken as being representative of the COVID-19 experience.
With that in mind, our patient-led analysis on COVID-19 experience is the first of its kind. We believe our participatory research may shed light on the short and long term effects of this virus that is currently underrepresented in academic and media reports. While the medical community’s primary focus is on those with acute severe conditions, respondents of this survey represent those with mild to moderate symptoms with a prolonged recovery who may or may not have received medical support in their region. Our data analysis, alongside anecdotal reports in the Body Politic support group, captures the following:
- Impacts of the timing of testing on the status of results
- Cyclical symptoms experienced unexpectedly for over six weeks at time of response
- The nature, severity, and recovery time course of symptoms week by week
- An analysis on differences in time course of symptoms reported by patients with positive and negative test results
- Internal and external stigmas experienced by patients in recovery
- Impacts on lifestyle including physical activity and self-isolation
We recognize and want to emphasize that COVID-19 appears differently in each person, and we hope that this report can help medical professionals and researchers understand more about this virus from the patients’ perspective, and be a jumping off point for further research. We also hope that our analysis will give family, friends, employers, coworkers, and the general public better insight into some of the experiences of people living with COVID-19.
This version of the survey is now closed. We have listed future plans for this research we hope to address with more resources in the section on Future Work.
Highlights from the Survey Analysis
- Almost half of the respondents (47.8%) were not tested (denied testing or did not have access to a test) and the other half were nearly split between those who tested negative (yet still presented COVID-19 symptoms) and those who tested positive for COVID-19.
- Respondents who reported testing positive were tested earlier in their illness on average (by day 10) than those who reported testing negative (on average tested by day 16). This difference between the two populations is statistically significant. This could reinforce the importance of testing symptomatic people early. See the Testing Section for additional information.
- Over half of respondents (57.8%) listed at least one pre-existing condition, with the most prevalent conditions being asthma and vitamin D deficiency. Our analyses suggest pre-existing asthma might prolong recovery time. See the Pre-existing Conditions Section, and Recovery Timecourse Section for additional information.
- The vast majority of participants with symptoms experienced fluctuations both in the type (70% reporting) and intensity (89% reporting) of symptoms over the course of being symptomatic. See the Nature and Severity of Symptoms Section for additional information.
- At the time they took the survey, 90.6% of the respondents had not recovered (Recovery was Self-Interpreted for this Survey). For the 60 respondents who had recovered, the average length of time of being symptomatic was 27 days. The respondents who had not recovered had been experiencing symptoms for an average of 40 days, with a large proportion experiencing symptoms for 5-7 weeks. Our “survival analysis”, shows that the chance of full recovery by day 50 is smaller than 20%. See the Recovery Timecourse Section for additional information.
- On Symptoms (See the Symptoms Section for additional information)
- A slightly elevated temperature (above 98.6°F but below 100.1°F) was more commonly reported than higher temperatures (100.1°F and above).
- In addition to the more widely recognized COVID-19 symptoms such as fever/elevated temperature, cough, and shortness of breath, the other symptoms that were highly reported by participants included fatigue (varying in severity), brain fog/concentration challenges, chills/sweats, trouble sleeping, and a loss of appetite. It is interesting to note that neurological symptoms were consistently reported by patients for eight weeks, specifically brain fog/concentration challenges and trouble sleeping.
- Patients from this survey indicate that their first week of experiencing symptoms had milder/fewer symptoms than weeks 2 and 3. Gastrointestinal symptoms and chills/sweats seem to occur more often in weeks 1-2 and respiratory symptoms appear relatively consistent through weeks 3-4.
- Top 10 symptoms reported over the course of the 8 weeks by this group ranked by highest to lowest are: mild shortness of breath, mild tightness of chest, moderate fatigue, mild fatigue, chills or sweats, mild body aches, dry cough, elevated temperature (98.8-100), mild headache, and brain fog/concentration challenges.
- For this group, when comparing respondents that tested positive versus negative, only 2 of 62 symptoms (loss of smell and loss of taste) came back statistically significant, even when accounting for the point at which the respondent was tested. All other symptoms, including dry cough, loss of appetite, shortness of breath, tightness of chest, elevated temperature, fever (100.1 or greater), GI symptoms, lung burn, elevated heart rate and tachycardia, brain fog/concentration challenges, and dizziness, were not statistically different between the groups reporting positive test results and negative test results.
- Neurological symptoms are being underreported in the media. These include brain fog, concentration challenges, memory loss, seizures, dizziness and problems with balance, various forms of insomnia, and others. Brain fog and concentration challenges were a more common symptom than cough during most weeks, as was insomnia.
- Most of the respondents were not hospitalized. Many did visit the ER/urgent care to seek treatment, but they were not admitted to or stayed overnight at a hospital. See the Hospitalization Section for additional breakdowns and for further detail on this topic.
- The response of respondents’ satisfaction to medical care was varied with a small percentage being very satisfied with their medical care. Respondents who have been offered follow-ups and check-ins by phone, video, or chat from medical staff have reported that they felt supported independent of their treatment being medically effective. Respondents who felt unsupported often reported having been dismissed or misdiagnosed by health professionals. They were told to stay home, and sometimes denied resources such as prescriptions and further testing. Respondents that felt somewhat supported reported receiving conflicting outlooks and advice from different medical staff. In some cases, switching to another health care provider or specialist resulted in better support. See the Support by Medical Staff Section for additional information.
- The decision to share personal stories about COVID-19 experiences was fairly split. Many have chosen to share privately, and some changed their mind as time went on. See the Sharing on Social Media Section for additional information. Those who shared reported wanting to help others based on their experiences, wanting to attract more support from people just like them, and wanting to educate and contribute to remove stigma. Those that didn’t share on social media explained they chose not to out of fear of being stigmatized, especially by work; because they did not want to mislead with false information if they were not tested or received a false negative test; because they did not have enough energy nor time to deal with responses; and because they wanted to stay private.
- Respondents had a major decline in physical activity since contracting the virus. Before being symptomatic, 67% of respondents said they were very/moderately physically active. At the time of the survey, 65% reported now being sedentary or mostly sedentary.
Respondent Background Data
How Respondents Found the Survey
The majority of respondents found the survey through the Body Politic COVID-19 Support Group on Slack (75.4%). More than a quarter of respondents found the survey through social media sites like Facebook, Twitter, and Instagram.

Figure 1. Distribution of responses to “How did you find this survey?”
Demographics
Most respondents are from the U.S. (71.7%), followed by the U.K. (12.7%), Netherlands (4.2%), Canada (1.9%), Belgium (1.7%), and France (1.4%). Other countries represented include Sweden, Ireland, Germany, Belgium, Scotland, Italy, Russia, Spain, South Africa, Greece, and India.

Figure 2. Demographics of respondents (world-wide)
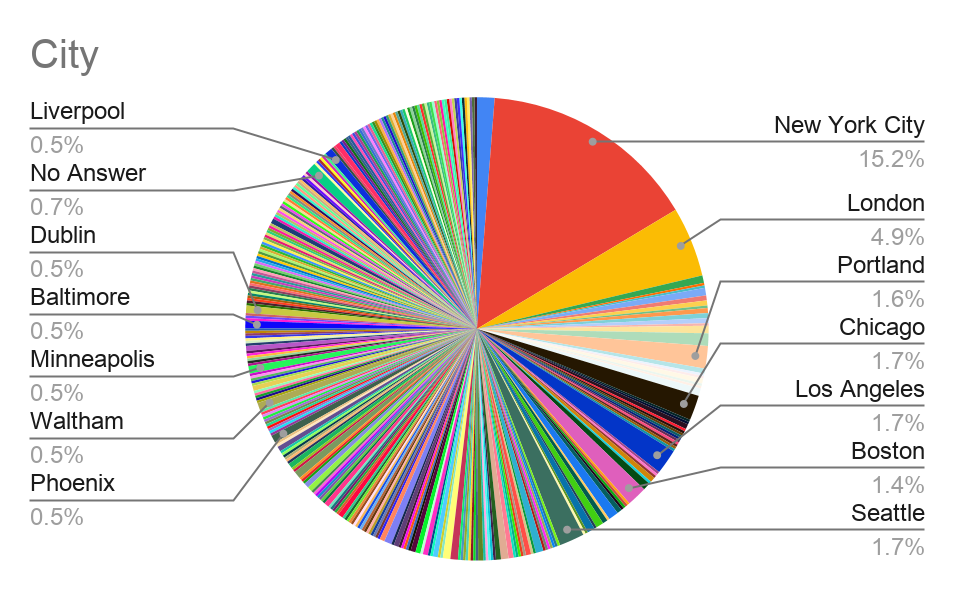
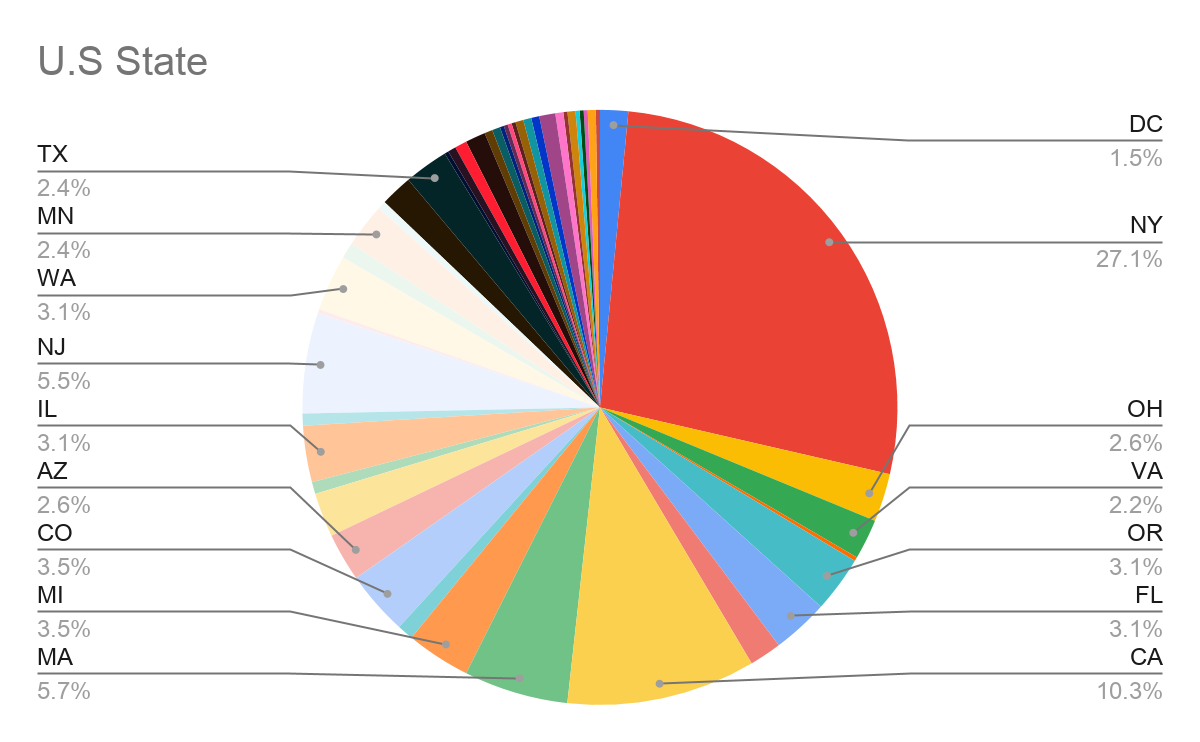
The state of New York is home to the largest percentage of respondents (27.1%), with 15.2% of all respondents from New York City, followed by California, Massachusetts and New Jersey. There are 4.9% of respondents from London.
Figure 3. Demographics of respondents (USA)
The ages of the respondents are varied, with the majority of respondents between the ages of 30 and 49 (62.7%).
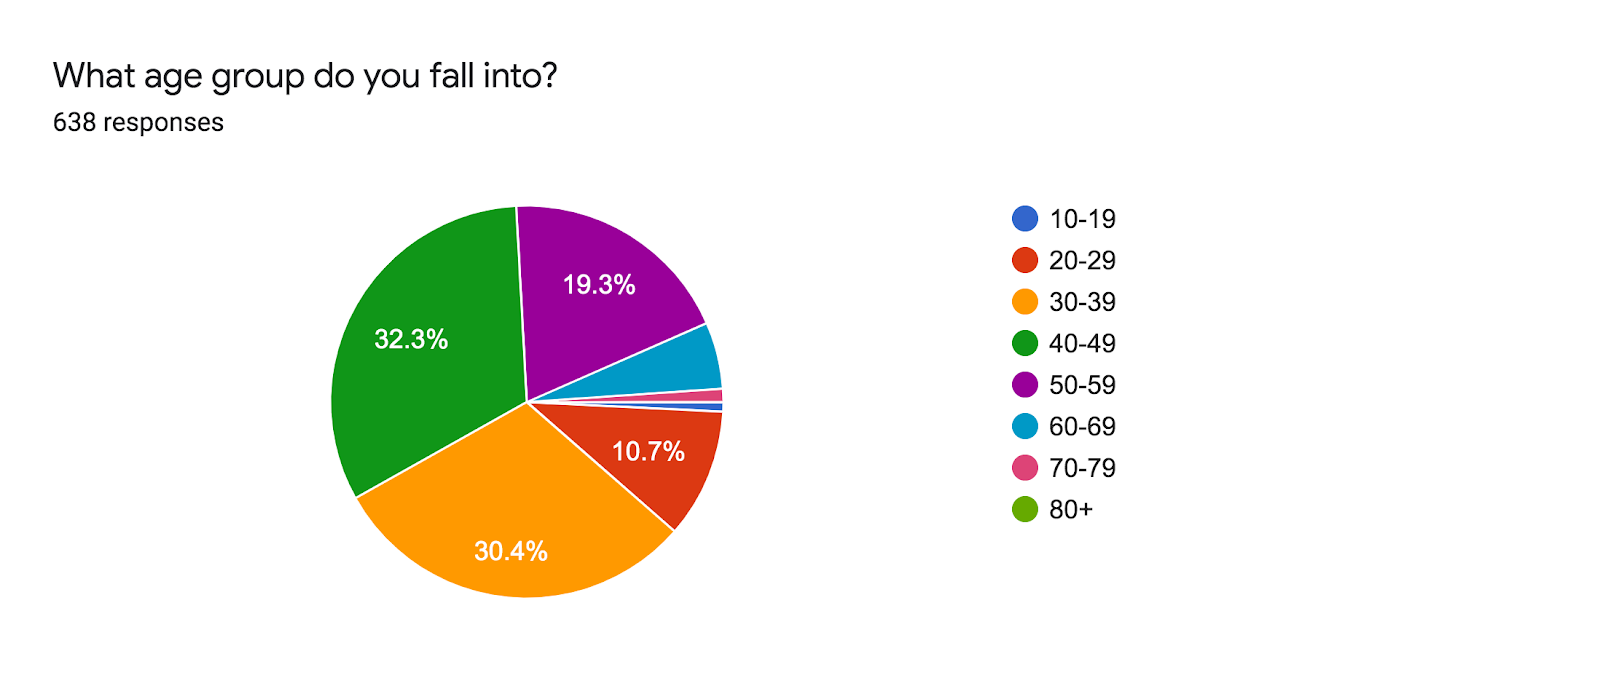
Figure 4. Age distribution of respondents
Over 76% of the respondents are White/Caucasian. The ethnicities and races were grouped into categories to simplify calculations. See mapped groups in the Appendix.

Figure 5. Ethnicity of respondents (world-wide)
The majority of respondents are Cisgender Female (76.6%).

Figure 6. Gender of respondents (world-wide)
As noted above, when considering the results of this survey, it is important to keep in mind that this sample is not representative of all COVID-19 patients. Sampling bias is at work here: both in who would be willing and able to take a survey, and who would have exposure to the survey.
Testing Status
Despite all experiencing COVID-19 symptoms, almost half of respondents (47.8%) have not been tested either because they were denied testing for not meeting the testing guidelines in their country or state, were denied testing because of insufficient tests available, or did not attempt to get tested. Of those who were tested and have received results, 46% tested positive and 54% tested negative.


Figure 7. Testing status of respondents (top) and those who received positive or negative result (bottom)
Following figure shows the full distribution for the testing time w.r.t the symptom onset. The average number of days between first experiencing symptoms and getting tested was 10.04 (mean) +/- 12.18 (SD) days for those who tested positive and 16.14 (mean) +/- 12.95 (SD) days for those who tested negative. The difference between the two groups is statistically significant (p-value < 0.001, Two-sample t-test, similarly p-value < 0.001 based on the non-parametric Mann-Whitney U-test).

While it is difficult to draw conclusions from these results, it is worth noting that despite most respondents experiencing COVID-19 symptoms for weeks, the majority tested negative once they were able to get a test. Since the respondents who tested positive were tested earlier on in their illness on average than the people who tested negative, this could reinforce the importance of testing symptomatic people early. Research published here reinforces this finding.
A quote that we pulled from the survey that describes a patient not getting tested early on with mild symptoms, but then relapsing and still being symptomatic on day 27:
“I avoided seeing a doctor because my symptoms were not dangerous, but after a relapse on day 27 I went to a covid clinic. I had to be referred through my regular clinic, and I still haven’t received my test results (10 days later)“
Patients’ Medical Background
Pre-existing Conditions
Over half of respondents (57.8%) listed at least one pre-existing condition. Asthma (16.9% of all respondents) and vitamin D deficiency (13.4%) were the most prevalent conditions, followed by acid reflux disease (10.5%) and pre-existing auto-immune diseases (10.5%). See Recovery Timecourse Section, for more information about possible correlation between pre-existing conditions and recovery time.
Note: the survey originally included seasonal allergies and mental health conditions such as anxiety and depression listed under pre-conditions; however these will be grouped and analyzed separately in a future analysis/report. The data analyzed here does not include mental health conditions or seasonal allergies

Figure 9. Percent of respondents with pre-existing conditions
Blood Types
While 44.9% of the respondents (n=284) did not know their blood type, of the 356 respondents who did, the most commonly reported blood type was O+ (31.74%) followed by A+ (29.21%). See Figure 10 for the full distribution.

Figure 10. Blood type distribution for the United States and United Kingdom from wikipedia (https://en.wikipedia.org/wiki/Blood_type_distribution_by_country)
Physical Activity
The majority of the participants reported being moderately to very physically active (68%) before the onset of symptoms. After the onset of symptoms, a majority of respondents reported being sedentary or mostly sedentary (70.6%).

Figure 11. How physically active respondents were prior to the onset of symptoms?

Figure 12. How physically active respondents at the time of survey?
In the “Other” category for “How physically active are you now?”, respondents who were previously moderately or very active described their inability to exercise, or a worsening of symptoms following attempts at physical activity.
Below are quotes from respondents describing their experience with physical activity:
“I can’t do any [exercise] my HR goes up very quickly and I get shortness of breath.”
“I have not had strength to return to physical activity. I did work in my house and 2 days later had a fever again after being 12 days fever free.”
“I am trying but my lung capacity is still so low that just walking has me gasping for air.”
“The one time I tried to do a regular exercise, I was too out of breath after 1/4 my usual time so I stopped early. That was probably 3-4 weeks ago.”
Based on anecdotal reports, we speculate that post viral fatigue plays a role in the decrease of physical activity. We also recognize that a shift in physical activity levels may be in part due to a change in lifestyle with new quarantine and self-isolation guidelines. Further research can be done to compare activity data against a larger population.
Symptoms – Introduction
Severity and Nature of Symptoms
89% of the respondents selected “Symptoms fluctuated in intensity and frequency” in response to a question asking a respondent to “Describe the nature of your symptoms (Check all that apply).” 70% of the respondents selected “new symptoms appeared at different times.”
A survey participant summarized the fluctuations of symptoms commonly shared by many COVID-19 patients as follows:
“The symptoms were like a game of whack-a-mole. Different ones would surge at different times and in different places in my body. “
The other two options “I had the same symptoms the entire time” and “All symptoms subsided completely (for 1 week or longer)” had much fewer responses, 6.25% and 5% respectively.

Figure 12. Nature of symptoms across the recovery period
Other common responses describing the nature of symptoms participants included under the “Other” option are summarized as following:
- Symptoms came back or intensified with physical activity
- Slow progression of symptoms
- Most symptoms have subsided but a few symptoms remain (most noted were fatigue and shortness of breath especially with exertion; others mentioned cough, skin rash, and elevated temperatures)
- General improving trajectory
- Intensity of symptoms decreased but psychological burden increased
- Most severe symptoms were during weeks 2-3
- Very slow recovery with return of certain symptoms in a cyclical nature
- Symptoms got better and then worse again
- Some symptoms were consistent the whole time
- Symptoms would disappear for a few days then come back
A few quotes pulled from the survey describing the relapse and lengths of symptoms:
“Feel like no one believes you if you avoid hospitalization and that symptoms persist. This is unlike other illnesses when you start feeling better you are truly in the mend. This is very up and down.”
“I am 20 years old and very active. I see a lot of my friends not taking social distancing seriously because they don’t think it will affect someone of their demographic. Yet here I am, super sick for a month now.“
“Feel terrible for a week then have 2 good days then back to feeling terrible. And when I say 2 good days that just means I can walk to the kitchen without feeling like I need a break in between. I feel as if I have more of a disability now then just some virus bug.”
Over 50% of the respondents reported feeling the symptoms most strongly during the evening.

Figure 13. What time of the day do you feel the symptoms most strongly?
Recovery Timecourse
At the time they took the survey, 90.6% of the respondents had not recovered. For the 60 respondents who had recovered, the average length of time spent being symptomatic was 27 days. The respondents who had not recovered had been experiencing symptoms for an average of 40 days, with a majority experiencing symptoms for 5-7 weeks.
Number of participants who had reached week x (1-8) in the survey:

Figure 14. Number of respondents who had experienced symptoms for certain number of weeks at the time of survey
The following graphs show the full distribution of symptom durations for various groups. Left: the fraction of respondents, with positive (orange) or negative (blue) tests, who experienced certain days of symptoms. Right: similar to Left, but for non-recovered (tested or not, in blue) participants vs. recovered. Participants who have self reported recovery (green), have significantly shorter symptom duration compared to the rest of the participants. This could reflect the bias in our survey demographics i.e. we have mainly targeted people with prolonged recovery durations.
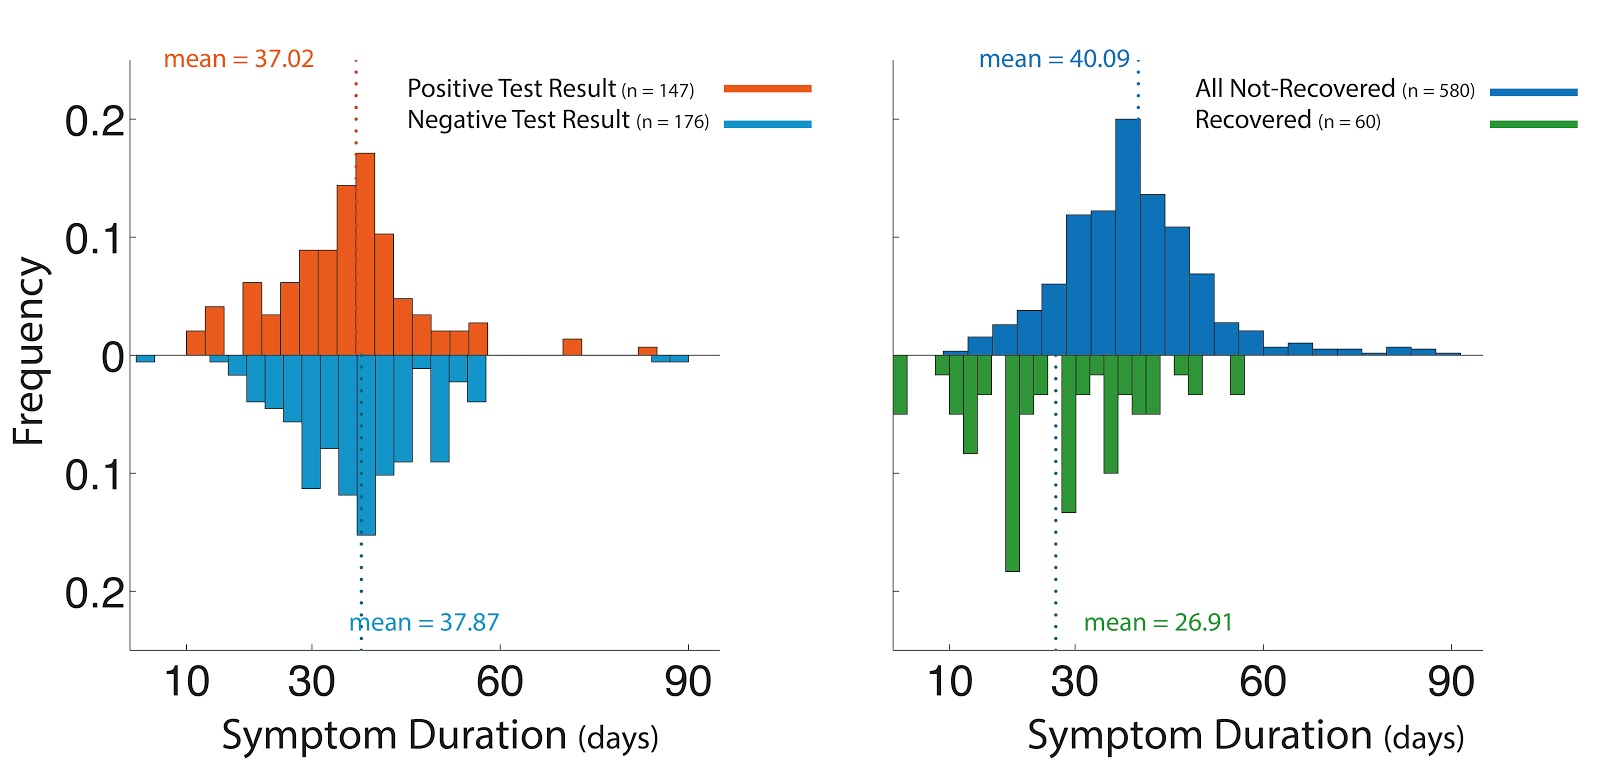
Figure 15. Distribution of symptom duration for various groups of respondents
We have also looked at the survival function, often used to show a patient’s probability of survival following disease or treatment. But, in this case, it’s the symptoms’ probability of persisting. This is a principled way of quantifying and comparing recovery times, accounting for the fact that subjects took the survey at different times and many of them have not yet recovered. When comparing curves between two groups of subjects (e.g. those w/ positive vs. negative test results), a group whose curve decays more slowly will take longer on average to recover.
These plots show the recovery time course for different groups of subjects. The x axis gives the number of days since symptom onset, and the y axis gives the probability that recovery will take longer than the specified number of days (e.g. looking at the orange curve, there’s 80% chance that recovery takes more than 50 days). Survival functions were estimated using the Kaplan-Meier estimator. Colored regions are 95% simultaneous confidence bands, representing uncertainty about the estimated survival functions. A high degree of overlap between confidence bands indicates that differences between two curves are small relative to random/statistical fluctuations. Although Negatives seem to have a slower recovery, given the high overlap between confidence bands, this could hint that the survival functions for two groups of Negative or Positive test results may be statistically indistinguishable, given the available data. But, a more formal statistical test would be needed to support this conclusion (e.g. log rank test).
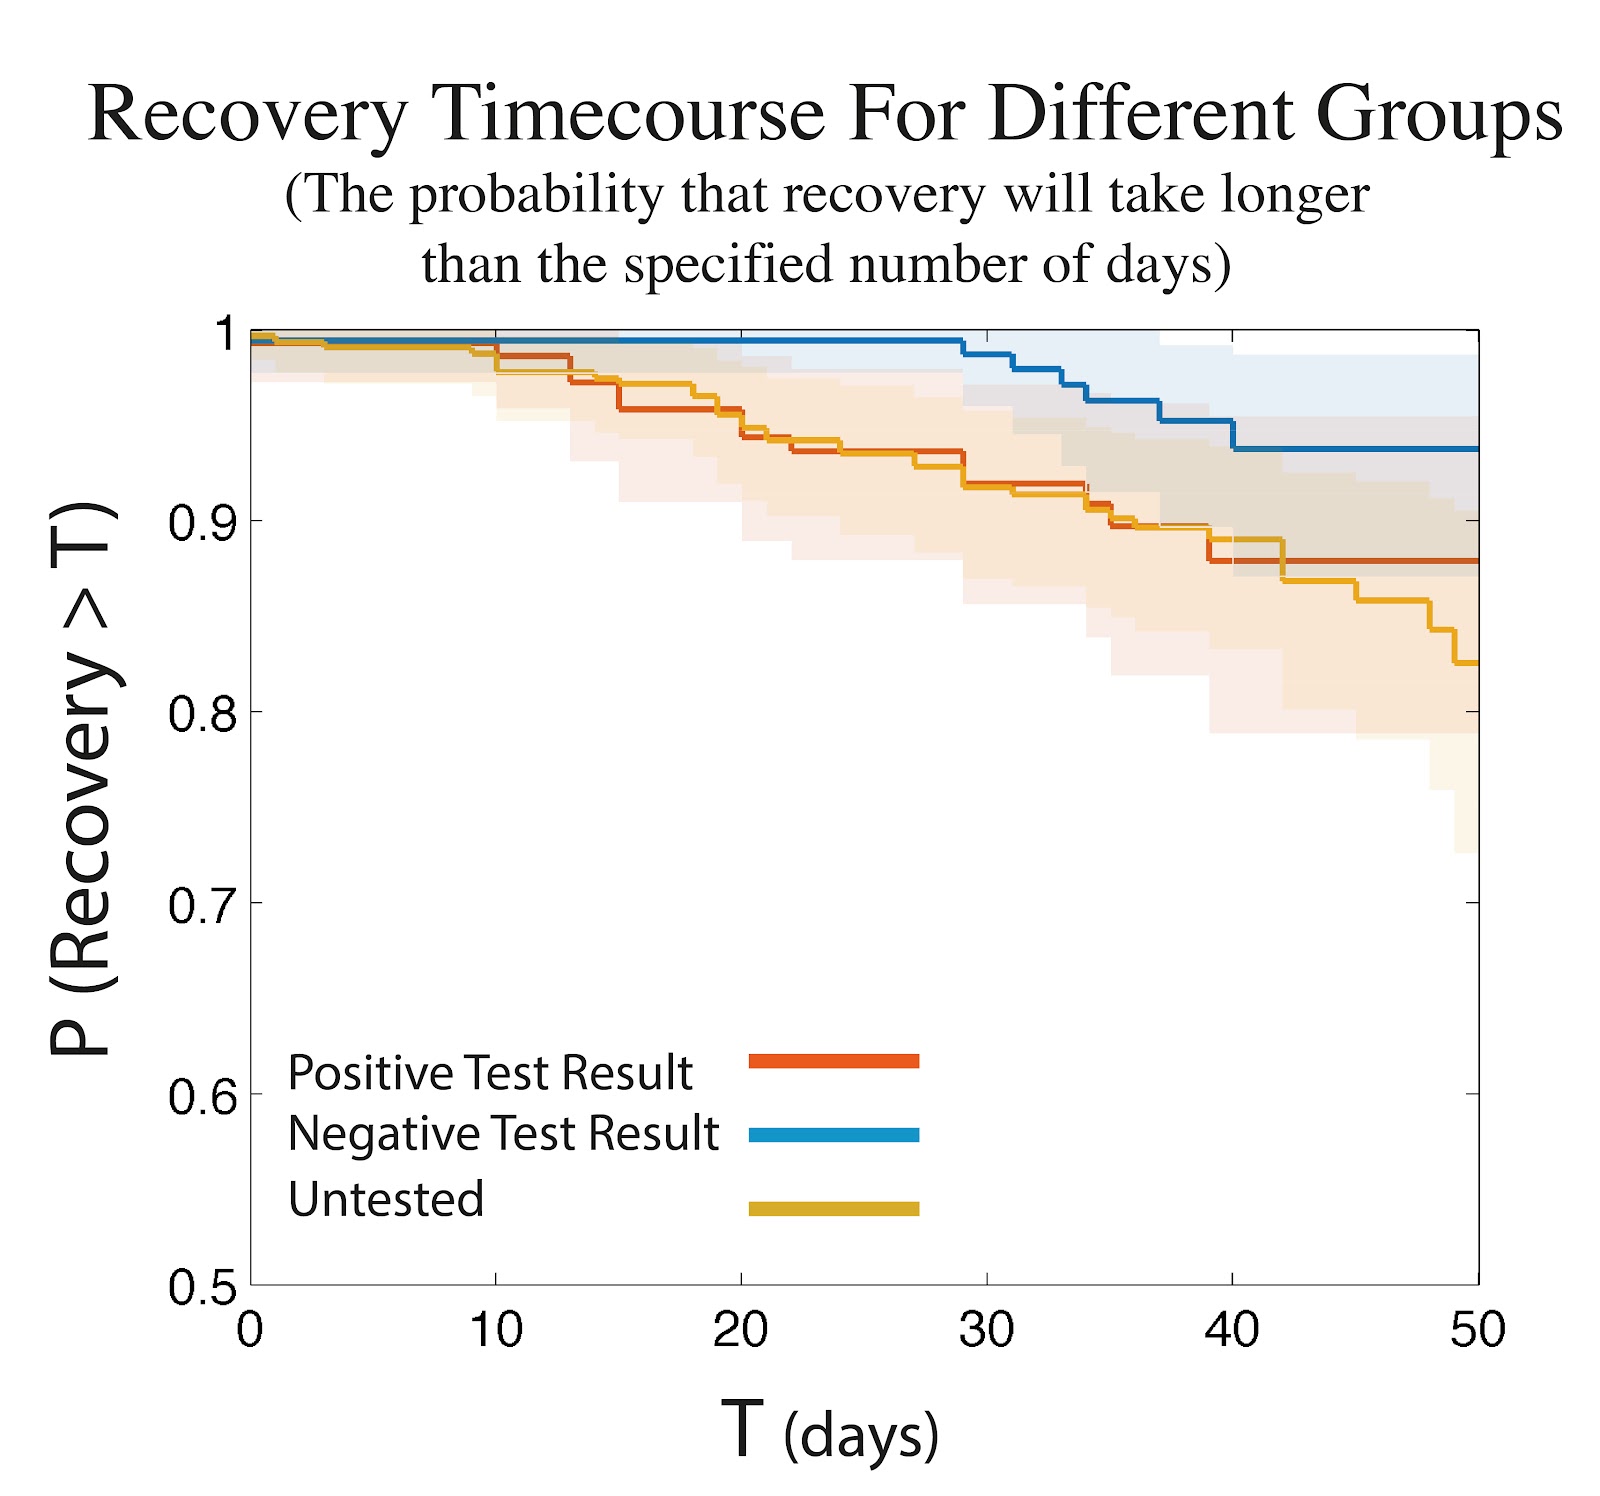
Figure 16. Survival function – The probability that recovery will take longer than T (number of days)
Conditioning on the most prevalent pre-existing conditions among the respondents, i.e. Asthma and Vitamin-D deficiency, we only found Asthma to possibly be correlated with increase in recovery time. The plot below shows the same survival analysis, for participants with or without asthma (Left), and participants with or without Vitamin-D deficiency (Right).

Figure 17. Similar to Figure 16, for groups with or without Asthma (Left), or Vitamin D deficiency (Right)
Symptoms – Analysis
Comparing Symptoms Between Positive and Negative Results
One of our most surprising findings was that of the 62 symptoms, only two were statistically significant (within this group) between the positively-tested respondents and the negatively-tested respondents: loss of smell and loss of taste. All other symptoms, including severe ones such as shortness of breath, tightness of chest, elevated temperature and fever, GI symptoms, lung burn, elevated heart rate and tachycardia, and dizziness, were not different between these groups. This could indicate that current tests are not picking up on a subset of COVID-19 patients, and further investigation into whether tests are accurately capturing the presence of the virus is encouraged.
The following plots show the fraction of symptoms reported by participants (negative test results in blue, and positive test results in orange), for weeks 1 to 8 after the symptom onset. Colored bands show 95% simultaneous bootstrap confidence bands (coverage is adjusted for multiple comparisons over all time points and symptoms). Loss of smell and taste (symptoms #19 and 20, as indicated by the red box) are the only symptoms reported differently between the two groups (reported more frequently by the group who tested positive, during the first 2-3 weeks). In these plots, all participants who have been tested were included (n = 177 positive test result, n = 147 negative test result), independent of the timing of the test relative to symptom onset. Importantly, the same result holds when limiting the analyses to those who have been tested within the first 10 days after the symptom onset (therefore controlling for testing time between the two groups).

Figure 18. Fraction of symptoms reported by respondents from week 1 to 8, for two groups with Positive (orange) and Negative (blue) test results
For all common symptoms by the difference between positive and negative respondents, please see the chart linked here.
Symptoms Reported Week Over Week
The symptoms reported by all respondents at any time are listed in order of percentage affected. For visual simplicity we have not included confidence intervals on the mean values. The top 10 symptoms reported over the entire 8 weeks by respondents are: Shortness of Breath (Mild), Tightness of Chest (Mild), Fatigue (Moderate), Fatigue (Mild), Chills or Sweats, Body Aches (Mild), Dry Cough, Elevated Temperature (98.8-100), Headache (Mild), and Brain Fog/Concentration Challenges.
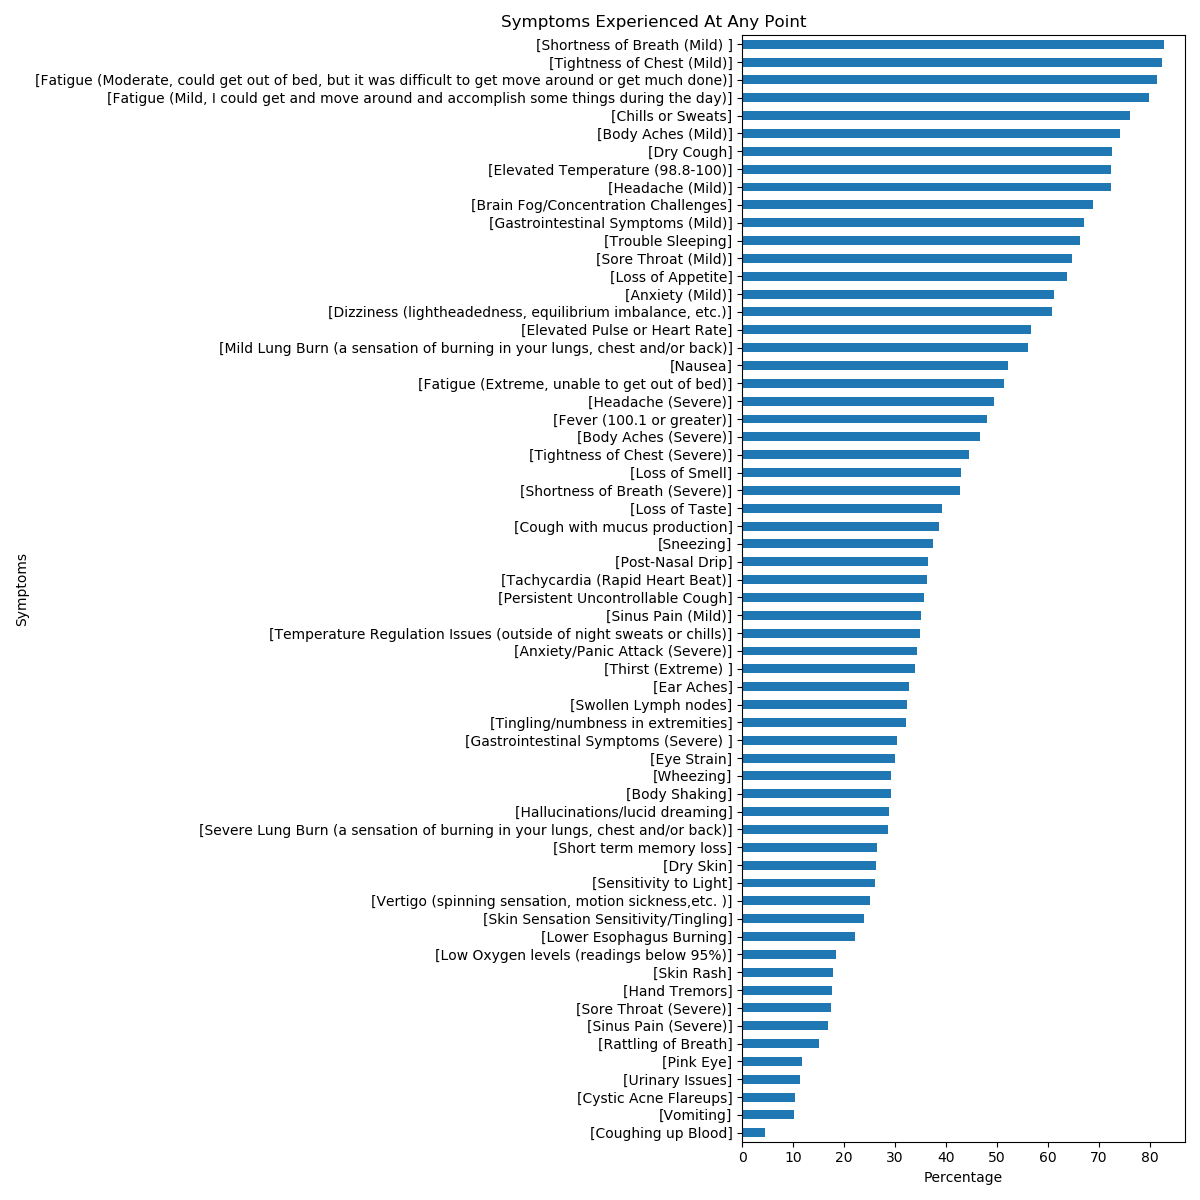
Figure 19. Percentage of 62 different symptoms reported by respondents
Top Conclusions from the Analysis & Charts
The following section outlines some of the analysis and charts mapped for the symptoms reported from week 1-8. One thing to note is that the majority of the respondents had not reached week 7 so our data is lacking in responses from weeks 7 and 8. We normalized the data/charts for this reason; each week’s data point is the percentage of people who had reached that week who were affected by the symptom.
In analyzing these graphs, we can see the following:
- Symptoms span not only the respiratory system, but also the neurological, cardiovascular, gastrointestinal, and other various systems.
- Patients from this survey indicate that week 1 was milder with less symptoms than week 2 and 3. Many symptoms seem to ramp up during week 1.
- Many immune system reaction symptoms, such as chills/sweats and fever, occur in weeks 1-2.
- Respiratory symptoms seem fairly consistent through weeks 3-4.
- Some symptoms are reported at about the same rate as the CDC listed symptoms (currently cough, sore throat, shortness of breath/difficulty breathing, fever, chills, muscle pain, and new loss of taste or smell). Some of these symptoms include elevated temperature (98.8-100.0), brain fog/concentration challenges, mild gastrointestinal symptoms, insomnia, dizziness (lightheadedness/equilibrium imbalance), elevated heart rate, mild lung burn, nausea, and both severe and mild headache. The ‘Other Symptoms’ section below is worth looking at for other notable symptoms.
This graph shows the percentage of respondents affected by the top 10 symptoms reported by respondents overall, over the course of the 8 weeks.

Figure 20. Percentage of respondents affected by the top 10 symptoms
Symptoms Grouped by Type of Symptom
The following charts display the percentage of respondents experiencing a group of symptoms from week 1-6. Weeks 7-8 were excluded from these charts because the majority of the respondents had not reached those weeks. The groupings include common respiratory symptoms, common neurological symptoms, common gastrointestinal & cardiovascular symptoms, common general immune system reaction symptoms and other less common symptoms reported by respondents.

Figure 21. Percentage of respondents affected by “Respiratory” symptoms

Figure 22. Percentage of respondents affected by “Neurological” symptoms
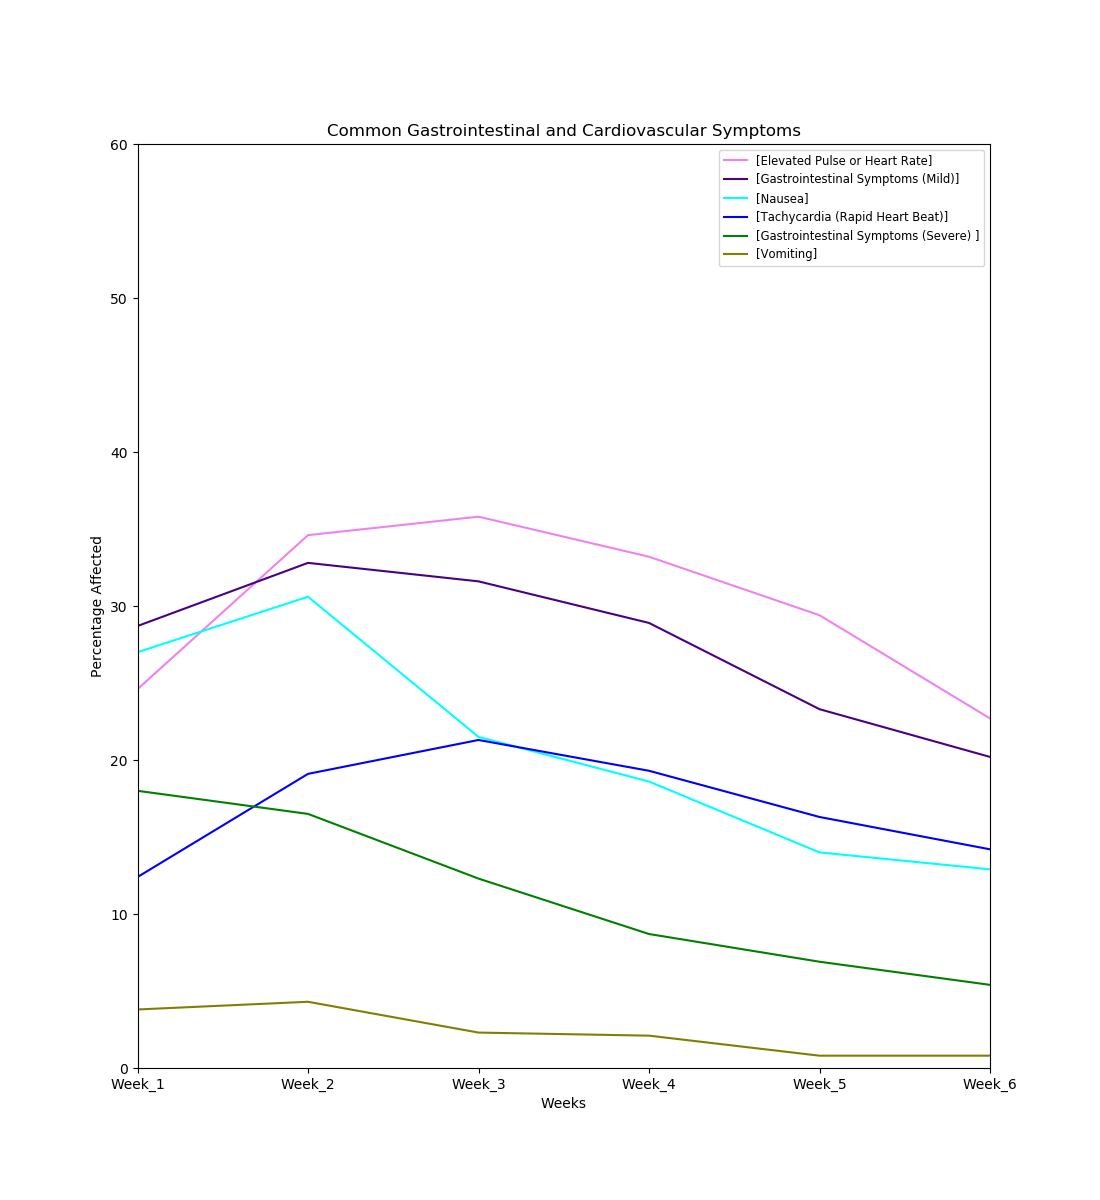
Figure 22. Percentage of respondents affected by “Cardiovascular” symptoms
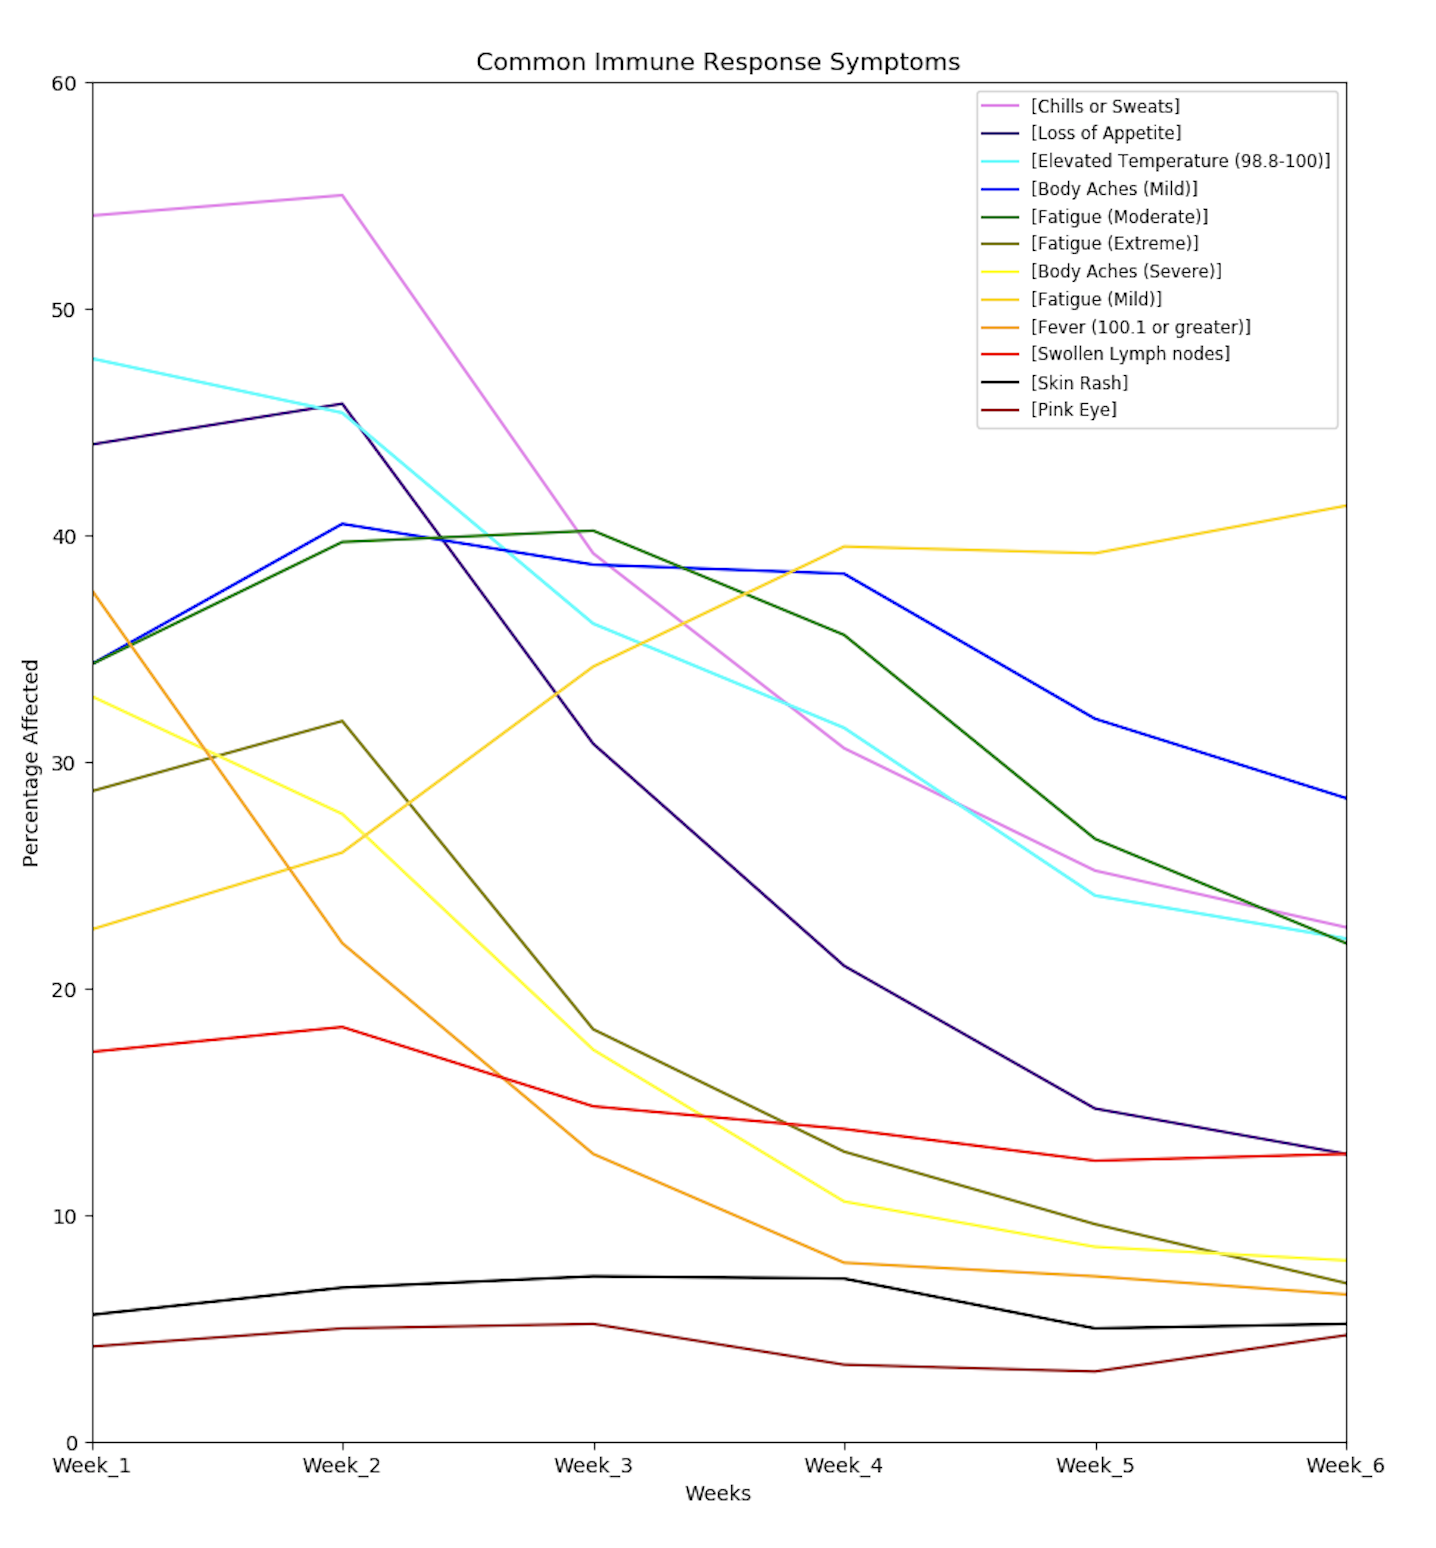
Figure 23. Percentage of respondents affected by “Immune response” symptoms

Figure 24. Percentage of respondents affected by other symptoms (non-respiratory, non-immune, non-cardiovascular)
Other graphs can be found here. The code to generate these graphs can be found here. (Symptom graphs generated and code written by Hannah D.
Other Symptoms
The symptoms section had a write-in question to add any symptoms other than the above list that respondents thought were related to COVID-19. Over 200 other symptoms were reported.
The most common written in symptoms mentioned multiple times included (starting from most common): chest pain, tinnitus, heart palpitations, back pain (both upper and lower), stiff neck/neck pain, coldness in extremities and other body parts, eye burning, joint pain, diarrhea, kidney pain, muscle spasms, fizzing/gurgling in lungs, spleen pain/upper left abdominal pain under the rib, metallic taste, sinus congestion, dry nose/mouth/throat, leg pain, lump in throat, body vibration/tingling, and flare-ups of pre-existing conditions (including endometriosis, tendonitis, stomach ulcers, breast tissue that had undergone radiation, herpes, and shingles).
Other notable but less commonly written-in symptoms include petechiae, changes to the ear/ear canal (including pressure, blockage, burning, and swelling), being woken up by shortness of breath, migraines, yeast infections/thrush, mouth ulcers, low temperature, exercise intolerance, rib pain, spine pain, changes in menstruation, high blood pressure, changes to the eye (including eye discharge and redness on the outside of the eye), costochondritis, constipation (one case lasting four weeks), bowel obstruction, gassiness/bloating, and seizures/fainting.
Other sensory symptoms mentioned included sensitivity to light, blurry vision, double vision, sensitivity to noise, phantom smells, enhanced sense of smell, and loss of hearing (in one case, for three weeks).
Some quotes we pulled out from the written-in symptoms in the “Other” option:
“Lost use of hands days 8-10. Very strange.”
“Internal tremors (head/neck) you couldn’t see them, but they noted them on EKG.”
“Visual aura migraines, extreme pain migraines (I have never had these before).”
“It felt like [the] virus was wandering and visiting all my weak spots. From migraine to quervain, from scars to vitiligo.”
“At some point I had absolutely no feelings and no ability to think.”
“When chest symptoms were at their peak, I would randomly feel a mild version of getting the wind knocked out of me – as if someone had suddenly punched me in the chest from the inside. Also, I sometimes have these fits of feeling extreme “over tiredness” when just lying in bed is somehow too much effort, and it’s like I’ve gone beyond exhaustion into (paradoxically) panic.”
Treatments
Hospitalization
The majority of survey respondents were not hospitalized; however, a large number of participants (37.5%) visited the ER/urgent care but were not admitted or spent the night. It is important to note here that hospitalizations were predominantly restricted to severe respiratory and cardiac Covid-19 patients due to the shortage of hospital resources during this first wave of the pandemic.

Of the 28 patients that were hospitalized the majority of them were hospitalized on week two.

The plurality of the patients that were hospitalized in our respondent group were hospitalized for 1-3 days.

Qualitative Analysis on Open Responses
Conducted by Hannah W.
Support by Medical Staff
If you sought treatment from a physician(s) and/or other medical staff, did you feel that the staff was attentive to your needs and concerns?
Half of 590 respondents felt that medical staff was somewhat attentive to their needs. 21.5% felt that medical staff were not attentive and 28.5% of respondents felt medical staff were very attentive to their needs.

The responses to this question were polarized. Listed below are general patterns about respondents’ satisfaction with medical care.
General Sentiment Analysis on Satisfaction with Medical Staff
| Very supportive | Not supportive | Somewhat supportive |
| Respondents who have been offered follow-ups and check-ins by phone, video, or chat from medical staff have reported that they felt supported independent of their treatment being medically effective. | Respondents often reported having been dismissed or misdiagnosed by health professionals. They were told to stay home, and sometimes denied resources such as prescriptions and further testing. | Respondents with mixed responses reported receiving conflicting outlooks and advice from different medical staff. In some cases, switching to another health care provider or specialist resulted in better support. |
Below are descriptive responses pulled from the survey on respondents sharing the experiences they had with physicians and medical staff:
“They are confused and reluctant to say, recommend, advocate or prescribe anything. They are totally at a loss.“
“I felt the medical team was dismissive. There were a lot of ‘we don’t know.’ Which is understandable, but difficult. One provider suggested that my shortness of breath was due to anxiety. As a person who does high intensity exercising 3x a week to a person who now gets short of breath changing her bedsheets, I found that dismissive.”
“My doctor was available via messaging, telephone, and telemedicine. She also contracted COVID-19 so she shared her experience with recovery and it helped me stay calm that I was on the right track.”
Relevant to this point, below are descriptive responses pulled from the survey on respondents sharing thoughts on the medical community focus:
“At this point, most physicians and researchers are so overwhelmed treating the covid19 patients who are at risk of immediate death, that they don’t have the ability to even recognize that people like me exist. Hopefully, with enough documentation, once the number of hospitalized patients decline, doctors will be able to concentrate on those of us who have persistent symptoms.”
“I don’t think the medical community is able to digest all of the information because they are busy treating patients. I believe people who experienced this offer the best answers at this juncture.”
Sharing on Social Media
Are you sharing your COVID-19 experience more publically on social media, blogs or other platforms?

The decision to share COVID-19 experience was almost split down the middle with slightly more people choosing to share more publically. Some have expressed sharing privately in closed groups, and some changed their mind about sharing publicly as time went on. The table below summarizes the main motives and beliefs around sharing.
Why or Why Not to Share
| I Shared my Experience | I Did not Share | I Changed my Mind | |
| Decision Driven By | Wanting to help others who are suffering Wanting to attract more support from people just like me Wanting to educate people who are not sick and make an impact on society |
Fear of being stigmatized, especially by work Did not want to mislead with false information No energy for others’ reactions Want to protect privacy |
Waited until I recovered to share to avoid stigma I shared more over time because I didn’t have enough energy while sick I shared less over time because I didn’t want to invite negative attention |
In particular, we looked into the kinds of stigma experienced by COVID-19 survivors. We found it to align similarly with models of stigma previously studied in neglected tropical diseases (NTDs) and in the Armed Forces. With slight modifications to this model based on context, we can fit COVID-19 stigma into six different dimensions, both internalized stigma (perceived by the self) and enacted stigma (discriminated against).
Six Types of Social Stigma

Below is a classification of stigma applied to those with prolonged COVID-19 symptoms. The analysis is still preliminary, but we can see how multiple types of stigma paint a clearer picture as to why COVID survivors with prolonged symptoms may be reporting a lack of support from healthcare and community.
Breakdown of Enacted (External) Stigma Experienced by COVID Survivors
Breakdown of Internalized Stigma Experienced by COVID Survivors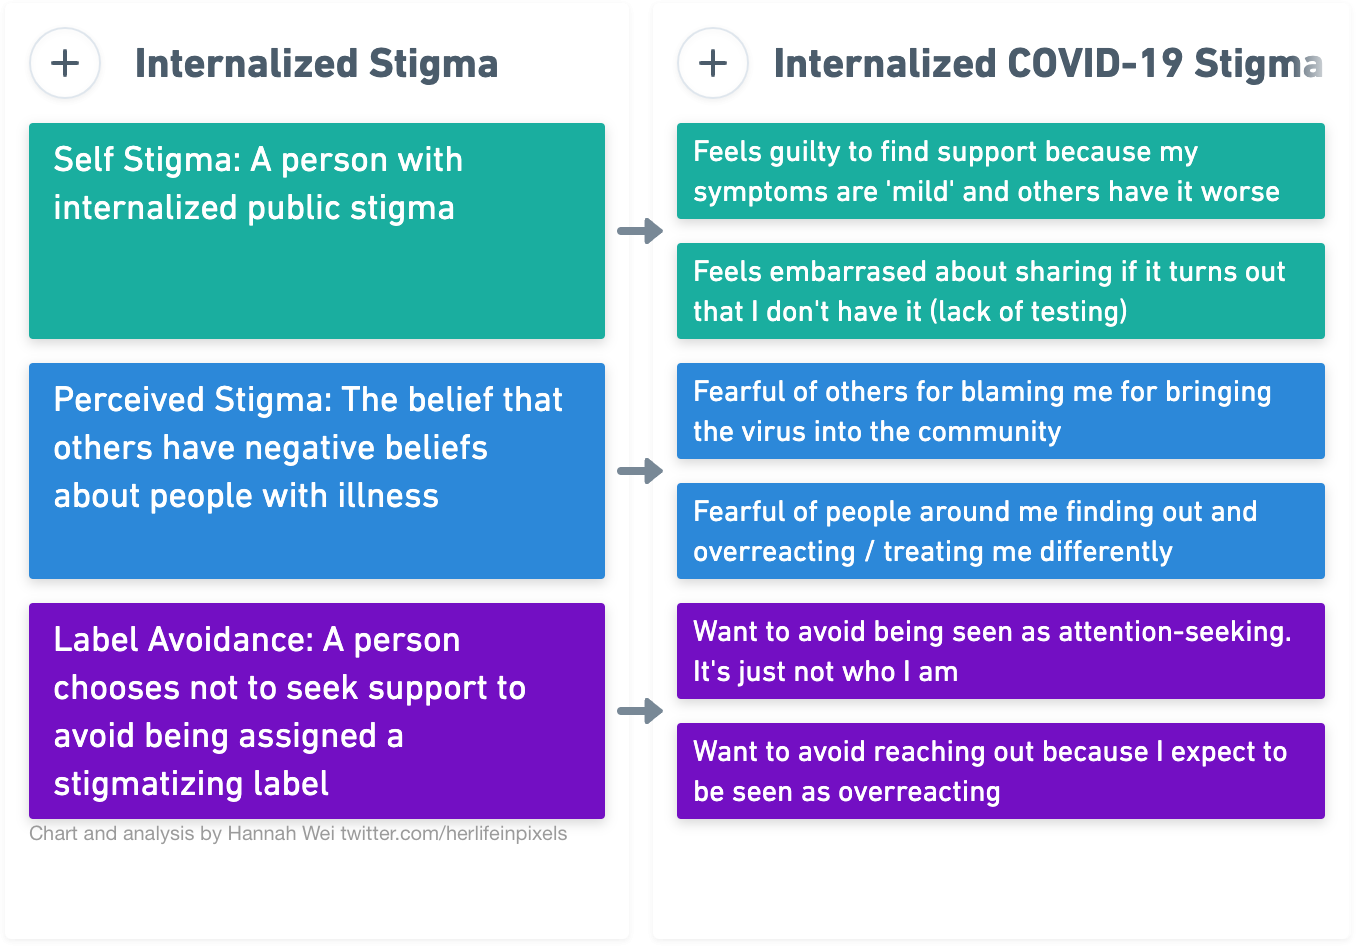

Of the respondents who did share on social media, the most common intent was to inform and empower others. Below are some of the responses pulled out of from the survey explaining why respondents shared their experience on social media:
“I want others to see that also young and healthy people can be affected and to show that it’s not just another flu.”
“I started sharing my experience because I needed answers from people that were experiencing the same issues as myself. Mostly recurring symptoms beyond the 14 day mark.”
Other Analysis
Other Medical Tests Performed
23% of the respondents said they received a flu test on either week 1 or 2 of symptoms. 35% of the respondents said they received a lung x-ray sometime between week 2 and 4 of symptoms. 32% of respondents said they received a blood test sometime between weeks 2 and 4.
The other options listed, CT-Scan, inflammation lab work and strep test were not received by patients as often. EKG tests was a popular response listed under the “Other” field for this question.


The following charts above are not normalized and do not take into consideration that patients are at different points in their symptoms/recovery. While the majority of respondents reached week 4 (585 out of 640), not many of the respondents had reached week 7 (203 out of 640) and 8 (84 out of 640). Therefore the latter weeks, 7 and 8, are lacking in responses.
Supplements & Medical treatments
Tylenol followed by Inhaler were top medications taken by respondents to treat symptoms. Supplements such as Vitamin C, Vitamin D, Zinc and electrolytes were taken by many of the respondents over several weeks. Hot liquids were also very popular with the respondents. Other popular entries for medications, supplements and treatments entered by participants in the “Other” field were the following: Mucinex, Prednisone, Steroids, Ginger, Magnesium, Steam, probiotics, Oregano oil/supplements, Flonase and other nasal sprays.
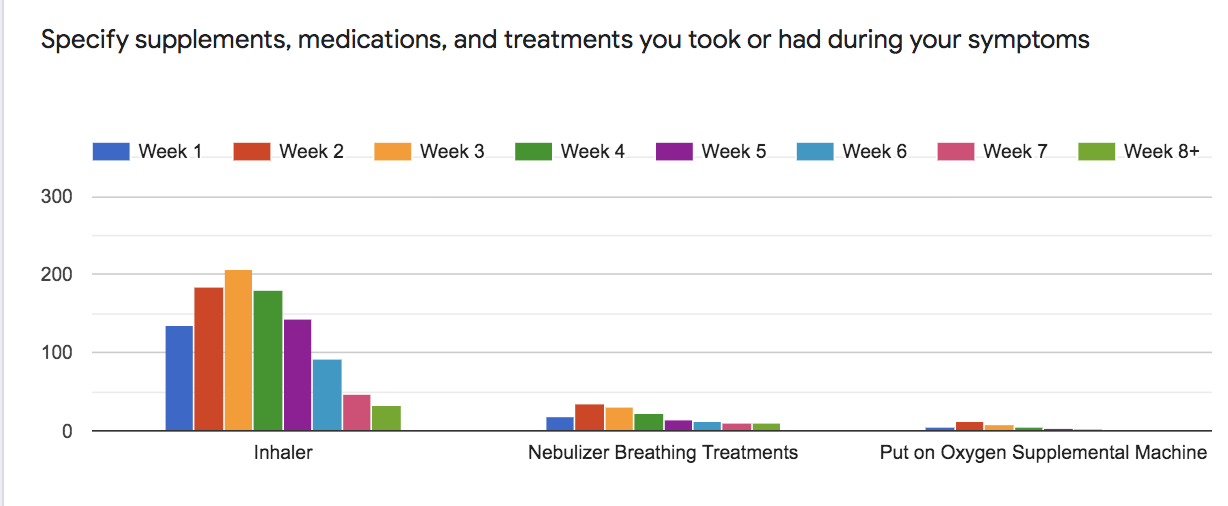

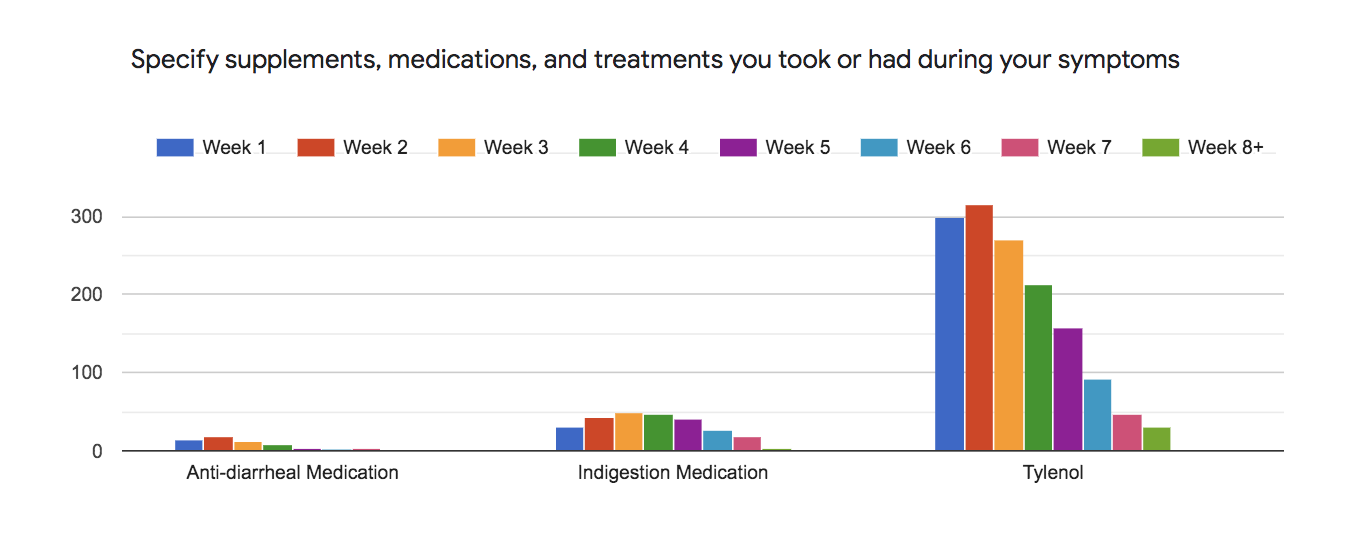


The following charts above are not normalized and don’t take into consideration that patients are at different points in their symptoms/recovery. While the majority of respondents reached week 4 (585 out of 640), not many of the respondents had reached week 7 (203 out of 640) and 8 (84 out of 640). Therefore the latter weeks, 7 and 8, are lacking in respondents.
Recreational Substances
The majority of respondents never consumed any of the following substances: smoke/vape nicotine, consume edible or liquid cannabis, smoke vape recreational cannabis, consume or/smoke CBD only products or consume recreational drugs. Many of the respondents said they occasionally or frequently consumed alcoholic beverages

Secondary infection
Secondary infections were not reported highly by this group. Aside from Pneumonia (13%), all other secondary infections were reported by less than 5% of the respondents.

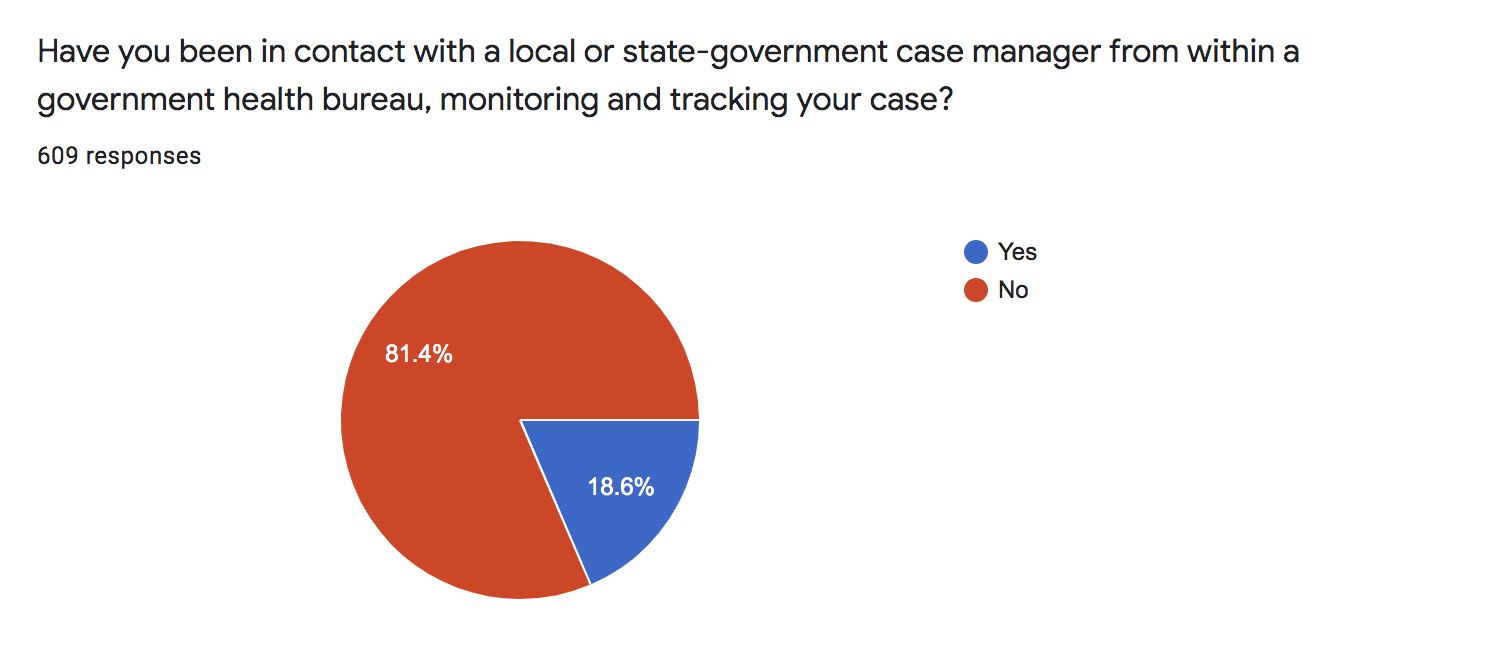
Contact with a local or state-government case manager from within a government health bureau
Only 18.6% of respondents had been in contact with a local or state-government case manager.
Ceasing Isolation
If you ceased isolation after self-isolating, what factored into your decision?
292 respondents out of the 640 total respondents answered this question. Many respondents selected a combination of options with the more than half of those responding selecting “Doctor/Medical Staff Recommendations” followed closely by “My Own Personal Judgement” as reasons for ceasing isolation. Many of the respondents added notes to the “Other” option with answers that are summarized as followed:
- Mostly isolated and only leave house if necessary
- Receive differing opinions on matters from different doctors or experts
- They ceased isolation due to the necessity to get food/critical items or due to family obligations and needs
- Not sure they had it at that point or had a negative COVID-19 test result, even though they had some symptoms left
A few respondents explained their confusion around ceasing isolation after a long period of being symptomatic in the “Other” responses, as described with these quotes:
“There are so many of us who are on week four five or six, are untested and presumed to have mild cases, yet we are unable to resume normal life and it is entirely unknown apparently whether we are contagious in these later weeks while we still are symptomatic.”
“[I] Fear that my family and I will have difficulty being accepted back into social circles when our stay at home order is lifted due to issues with getting testing to confirm no longer have the virus or testing for antibodies.”
Other Questions In the Survey not Analyzed in this Report
The survey included other questions, which have not been analyzed in this report. The questions that have not been analyzed are:
- Have you utilized other practices to support your healing process?
- What is your dietary lifestyle?
- Where do you get information about your illness?
- If you were hospitalized, how long was your stay?
- If you are in contact with a local or state-government case manager, how frequently have they been in contact with you?
- Access to Insurance
- Do you have health insurance?
- If you have health insurance, have services and treatment been covered by your plan?
- Did you recently lose healthcare coverage as a result of job loss or furlough?
Future Work
Based on input received from our participants and peers during an internal first round of analysis, we have determined important steps ahead for this research and research alike.
Improving the Questionnaire
Improved Definition of Recovery
When we co-created this survey with participants, we wanted to investigate ongoing COVID-19 symptoms beyond the two-week isolation guideline for those with mild infections. Our data includes everyone who has experienced any subset of symptoms traced back to COVID-19. As such, respondents who reported through our survey on whether or not they have recovered is subjective. Going forward, we are looking to include more input from medical experts. With ongoing medical research, we hope to establish a standardized definition of recovery based on symptom type, severity, and more accurate test results.
Investigate Relapse Triggers
As a patient-driven research initiative, we would like to expand our questions to investigate the experience of multiple symptom relapses during recovery as reported anecdotally in our community, as well as explore possible triggers for relapse (exercise, stress, alcohol).
Further Investigate Mental Health Effects of COVID-19
We look to build on our findings around stigma and dive deeper into modeling mental health struggles experienced by long-term survivors of COVID-19. In particular, we can conduct followup surveys and interviews on effects of cyclic symptoms on mental health, and well as look at correlations between treatments and mental health.
Improving the Analysis
Further investigation on the dataset could be done by stratifying patient experience by ethnicity, socio-economic status, and swab test result. This is especially true for questions around healthcare experience and the nature of symptoms reported. In particular, further statistical analyses to quantify patterns underlying symptom progression, in association with different factors such as pre-existing conditions, ethnicity, age, and test results can be particularly informative. In future, once more accurate antibody tests become widely available, it would be necessary to analyse the dataset, to look for correlations between timecourse of antibody development, and different symptom progressions.
Improving the Diversity of Participants
We plan to broaden the circulation of the survey to include a greater diversity of participants given that our data is heavily biased in gender (cis-gender female: 76.5%), ethnicity (white: 76.5%), and socio-economic disagregration (not collected). As for gender diversity, we recognize that women are more likely to seek out support than men, both in medical care and mental health support. The strategies to broaden outreach include expanding our survey to visible minority COVID-19 support groups, and asking our existing participants to share with men affected by COVID-19 in their family and community.
Moving Forward
We would like to take our learnings from this analysis and iterate on this survey developed through participatory research methods alongside more experts in research and public health. In the short term, our iterative updates will be posted in this document. We are actively seeking grants and partnerships to support this work. See contact information to get in touch.
Contact & Acknowledgements
Acknowledgements
We would like to thank the public health professionals, medical staff, and researchers who are working tirelessly to keep us and the rest of the world alive and healthy. We would like to thank the frontline essential workers who are keeping the grocery stores, pharmacies, restaurants, and so much more running and allowing us to have the food and medicine we need to recover. And finally, we would like to thank Fiona Lowenstein of Body Politic for creating a needed virtual space for us to support each other.
Data Access
The raw data, without any personally identifiable information, has been uploaded to a private GitHub repository. If you would like access to it, please send an email to patient.research.covid19@gmail.com and describe why and how you plan to use the data.
Contact Information
For questions about this report or for access to the data, please e-mail patient.research.covid19@gmail.com.
Appendix
Grouped Race/Ethnicity
| Grouped Ethnicity/Racial Background | Text Responses Included |
| White | Caucasian, White, Jewish, and British, , European American, White/irish german northern european, White (Ashkenazi Jewish), Norwegian, White Non-hispanic, northern European, Irish, Ashkenazi Jew,/Caucasian, European descent- white, Greek, Anglo, 1/2 Italian, 1/2 Northern European, Dutch, White British, Italian, White, Jewish, European Caucasian, White British /irish |
| Black/African American | Black, African, African American, Black/Carribean-American, Black African, Black not African American |
| Hispanic/Latino | Hispanic, Latino, Mexican american, Latin American, Brazilian |
| Asian | Asian, Korean, Asian – Chinese, Korean/Asian |
| Mixed | Mixed racial and heritage entered as White/Latin White/Asian, White/Hispanic, White/Arab, White with Cherokee ancestry, White/Brown, multi-racial,mixed ethnicity, Biracial Asian, English Chinese, North African / French, Mixed race – Asian, white, Caucasian (British, European) and Lebanese, Hispanic (white/Native American), Caucasian and Native American, blasian, White/Middle Eastern, White/Hispanic, Tsalagi, Scottish (White), multi-racial, Mixed( Filipino, English, Scottish, Slovenian, French, Irish),Hispanic/Asian, White/Persian, Asian/caucasian |
| Other Categories not displaying properly in this graph due to very small numbers of participants (less than 1%): Persian, included Native American, South Asian, Middle Eastern/Arab, North African, Pacific Islander |
Contributors
Report created and written by volunteers from the COVID-19 Body Politic Slack Group including: Gina Assaf, Hannah Davis, Lisa McCorkell, Hannah Wei., O’Neil Brooke, Athena Akrami, Ryan Low, Jared Mercier, and Adetutu A.
Survey Authors and Contributors Include: Gina Assaf., Tina L., Annie C., Monica S., Jared Mercier, Lauren N., Noel H., JD Davids, and Susie.
Thank you for this well presented article and the work you all put into it
Thank you so very much for this report. I feel I am a long hauler with this virus. I am at 14 weeks. This helps to know that what I have been feeling has been validated by your work.
Excellent report, so very badly needed for everyone who has had their lives turned completely upside down by the never ending loop of horrible symptoms this virus has hit them with.
I myself caught Covid-19 in March, as I write this today in July I am still on that horrible loop, don’t know if I’m starting to get better or just getting better at living with what this virus has done to me.
I live in Ireland, County Kerry specifically and as far as doctors are concerned they have been dismissive at best of “long haulers” and that’s being as polite as I can possibly put that!.
The Hippocratic Oath should be renamed the hypocrite oath.
So this report is very welcome and should be read by as many medical people as it can be distributed to around the world.
Many countries worry about hospitals being over run by people catching this virus but it’s the GP and doctor services that will be over run with people suffering from a myriad ailments from this virus, ironic really!!.
Thanks to all involved and I look forward to the next report. God Bless all who are suffering ongoing problems from Covid-19, hopefully we will all be stronger for this ordeal in the end.
Thank you!
I have been in this for 13 weeks now. Tested negative. Doctors have “no idea what it could be”. To the point that I worried it was just me.
I appreciate the research and effort to further understand Covid. This will help a lot of people. Thank you
Thank you for very detailed report. I just found out about your work and feel validated and not alone any longer.
Excellent research and fascinating article.
Perhaps you could consider crowd sourcing to obtain funds?
Thank you so much for presenting this. I have been trying to understand what has been happening since having the infection in June.
Thank you so very much for your extensive report. It appears I was exposed in February on a trip to Mexico. I did see a doctor there Who treated me aggressively with several prescriptions for flu related illnesses. At that time testing was unavailable in Mexico. I was there in Mexico until late March partly because I was not feeling well enough to travel and then travel was limited with many airlines, i can relate to almost 2 dozen of the symptoms I am reading here. I did not feel any relief from them until July although they certainly were sporadic snd ever-changing; the most concerning of all was the constant arrhythmia and Extreme exhaustion when I typically had exercised 1-2 hours daily before exposure. I was not tested until my first trip to the ER in the States for severe shortness of breath and that was in June where I tested negative. I have a better understanding and acceptance now of what was happening with my body after reading this report. I actually felt tears welling up in my eyes reading this because now I finally feel validated. I have been regaining my strength slowly but have not let my vigilance down. Thank you so much for the work you have done and hopefully opening the eyes of so many others who have not witnessed the results of this virus.
Maria Elena
Hopefully you’re feeling better now.
I’m a father of a 23 year old daughter looking for answers.
I’m wondering if you eventually tested positive? Did you take the antibody test? Any feedback would be appreciated.
I feel validated. Bless you. Something I can share with others when they express doubts about my situation. Thank you for spending your TIME and ENERGY on this, when there is so little of that left.
I have had 3 rounds of these symptoms now….the 3rd has been the worst …I am honestly scared to go to work in 4 days out of fear of how my body will react…
stress and physical exercise exacerbates the symptoms from my opinion…I have also experienced hair loss and weight loss may God give us all strength to prevail this scary bug and come out triumphant in the end
I am so pleased I came across this. I am nearing week 8 of being very ill with no end in sight. I had no idea there were other long haulers until I came across an article about it and my GP eventually said I must have long Covid. I couldn’t understand what was going on with me with all these symptoms and how they chop and change and come and go and throw me upside down and inside out day after day. I thought I’d lost my mind but now I know I’m not alone. I’m glad this problem is being recognised and I’m very appreciative of the work yourselves have done. Thank you.
Coming across this survey is probably the best thing that’s happened in a while. Some of the symptoms that I’ve experienced have never been mentioned in the few articles and “official” studies out there, but here in this one it’s reporting that there are at least dozens who are feeling similar symptoms as me. This has been so validating in a way because I’ve had doctors tell me I seem “fine” or symptoms are just “normal” when I know they’re not, which made me feel like I’m just making everything up, but this whole study has just reminded me that I’m not making it all up and there are hundreds of people who are experiencing the same problem. Plus, this study is extremely in depth and explained whereas the other two “official” studies I’ve come across have mostly been just about what symptoms people have feeling with rather vague analysis. Thank you to everyone who helped with this and this organization!
This has been one of the best reports I have read about Covid-19. I was tested positive for Covid-19 the last week of October 2020. The first 2 weeks felt like I had been hit with a severe flu, now after a month I’m feeling extreme fatigue, brain fog, back pain and more frequent
headaches. I felt like no one understood not even my doctor. Reading this article made me feel not alone. I’m going to email it to my doctor, maybe it will help him understand more. Thank you for all the time and work you all put into preparing this article. Stay safe.
Thank you for putting a voice to the otherwise (almost forced) silencing of this debilitating “post viral reaction.” I lost my job after 5 years with a renowned Children’s Hospital, my mind, and my identity.
I finally feel validated, heard, and relevant. But most importantly, asked about my symptoms and experiences with this now, 37 week battle.
Thank you very much. This article had me me revive all the symptoms I’ve had and continue having. Almost 9 months with this and still not feeling as before. It’s sad how not knowing I had very low vitamins D in my body until 4 months of getting COVID19 was horrible. I check annually and my doctor never made a test of my vitamins and I think all this could have been avoided, but now just praying and taking vitamins to live a day at a time. I’d like to show this to all the doctors, relatives and friends who thought everything was in my head. Those tears were real and I hope we all can get better at least in 1 year. I still have faith.🙏🙂👍❤
Thank you SO much for this, I çontacted u after my 3rd week, and have not had motivation or concentration to finish the survey. I now know that is what happened to me like so many others and maybe theres still hope to feel better. I went to the dr a dozen times, e.r. twice, and hospitalized for 5 days, and tested negative 3 times…but it wrecked me to the point of not being able to walk across the room. Lost my job when I got so sick, so no insurance now and cant afford the doctor, so I thought I was weak, dizzy, out of breath and buzzy because I was going to die soon! Knowing that others are taking forever to recover too, gives me hope. Prayers for all of us still struggling with this, that we all heal soon.
Thank you for this! I feel fortunate to have taken part. It feels almost surreal because it reflects not only my personal experience so well, but of the others, I have come in contact with through my social media group. There’s a lot of distress and confusion out there and this helps a lot for validating the long covid experience. Thank you for all the hard work and recognizing we are real!
I also want to thank you for this excellent survey. I have not had a test but contracted Covid 19 in February and have had Long Covid for a year. I think I was reinfected in the NHS in the summer. The severe fatigue, headache, rash, brain fog and intense muscle pain in lower back returned and I became worse all winter. I used to be very fit and have been functioning at around 24% of previous activity.
Medical staff have been at a loss to know how to help but I do think some could have been more understanding of Long Covid sufferers symptoms. I have just had the vaccine and had a strong reaction overnight – violent muscle pain in the same area which swelled up and headache – which reduced over the following day. I hope this is a sign of kick starting the immune system!
Thanks so much for this. I am at 1 year and still have problems. Just this week found a doc who took me seriously and performed tests. I have lasting heart and lung damage. Still stop mid sentence because the word won’t come to mind in any language. I was fit before I got this virus.
In October I started doing personal training. (strength) Since then my heart is stronger.
Also take Omega3 and D supplements. Have other weird symptoms which I only relate to covid after having seen others with them on social media forums. Thank God for those.
Good luck to everybody.
I’ve been diagnosed with long covid symptoms struggled since last year off and on health oroblems still no taste and smell effected my job I’m.a community care worker on my final warning due to much sickness .
I hope tou can find a Dr. Who understands long co-vid fast. You are probably disabled now. I was disabled before co-vid. A day after receiving my Pfizer co-vid vaccine upon discharge from the hospital (had joint replacement) I became extremely ill, fever with body aches, etc. & inability to call Dr or form complete sentences. It was scary according to my daughter. Was given antibiotics for a suspected uti. A couple of days later our entire household (5) became ill with co-vid. Again, I fell ill with the worst pain in my body and fever. I remember writhing in bed (with a new hip) thinking we all were going to die. It has been almost two years and I haven’t felt right since. I tire very easily. I nap sometimes 2x a day, i am very forgetful and lost my energy. I get occasional chills in warm weather and sweats at night. I get my blood tested every 3 months because I was dx’d with long ptt (slow blood clotting) at age 60.
My anemia is almost gone yet I am exhausted. Now I am wondering if I have long co-vid. I was a cna before an accident left me disabled and it is exhausting work even if you are healthy and young. My advice is get a good Dr and go for disability. It isn’t hard to get if you try. If they let you go at work because of this -you need to have income to live.
I make this entry for my husband, who, now for two years, (post his covid infection)has been suffering from “Functional Gastritis “ He just had his second endoscope and colonoscopy (in 2 years) that shows the same ‘slightly inflamed’ stomach lining. Yet, he lives daily with pain of 5-6 out of 10. All the meds including antidepressants and medicinal cannabis barely help. Drs don’t have an answer as to why such severe pain? This scares me because he doesn’t want to live like this with so much pain anymore. He has to sleep his life away to keep from feeling the pain.
He is striving to control diet, and do acupuncture, therapy, hypnotherapy and other mindful activities as well as prescriptions medicine. (I am trying to convince him to try mediation next.)
We are now looking for some sort of pain management , hopefully that doesn’t include narcotics. Anyone know of any immunotherapy for stomach pain? I feel so badly for all the folks who are suffering from long covid. 🙏🏽
Doctors can’t say it’s long covid as I was really poorly Xmas 2019, (before it came public) but all 4 of us were ill, I had 3 lots of antibiotics and steroids and had to go to hospital to be put on a nebuliser, since March 2020, I’ve not been able to eat anything, perhaps a couple of biscuits a day but constantly thirsty, where can I get help from
I’m normally a very healthy male. I’m 74 years young, but after COVID and recovering I’ve had a very low-grade headache located in the top forward part of my head. It seems to affect my vision in that I get these flutters in my vision. I still see clearly and focus well except for the periodic flutters as if the focus changes for a few seconds. I have Tinnitus which I’ve never had before but seems to only be in the right ear. I have pronounced hand tremors, more pronounced in the right hand. I also have a very slight nausea that comes and goes, and I don’t have the same appetite that I had before COVID, I also fatigue easily and don’t seem to have the energy I had before COVID.